A -sort of- measurement of the Higgs Boson mass
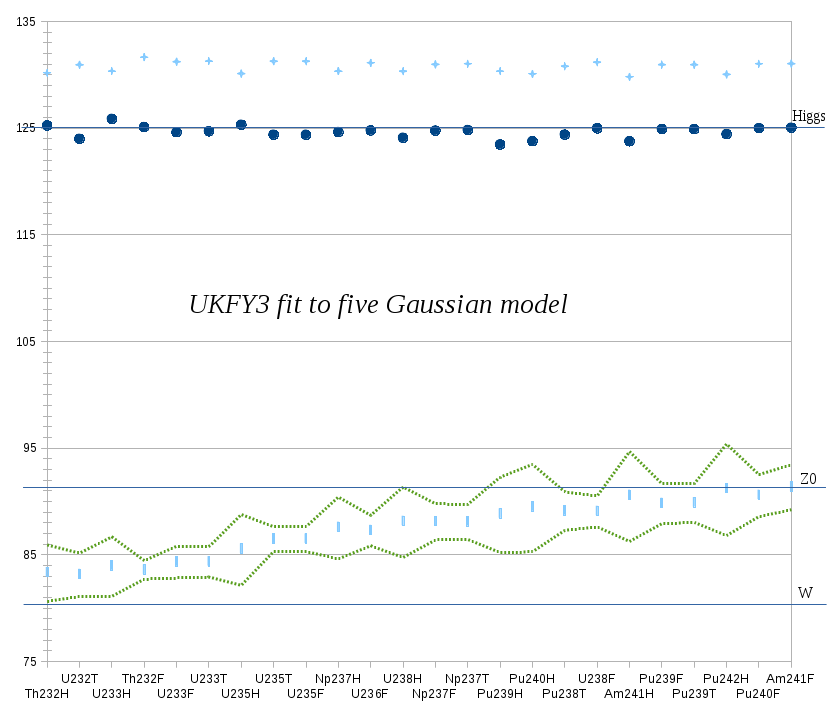
To put some numbers to our previous observations and go beyond eyeball line fit, we need to review the collections of nuclear fission data. There are two recent fits in the literature form which we can extract tables. The thesis of R.W. Mills «Fission product yield evaluation» (Birmingham, 1995), for the UKFY3 database, does a five-peaks fit of 24 (n,f) reactions, and we can pass to GeV the position of the asymmetric S1 channel and average all the reactions; this average is \(124.64 \pm 0.55\) GeV. Or we can use a more recent seven peaks fit, from D.M. Gorodisskiy, S.I. Mulgin, A.Ya. Rusanov, S.V. Zhdanov multi-modal analysis of (p,f) reactions (STI/PUB/1286, April 2008), and again look to the position of the S1 channel over ten different nuclides, getting an average of \(125.12 \pm 0.65\) GeV.
Channels in fission have been evaluated and systematized from the works of Wahl and, particularly, of Brosa, where one «standard symmetric» channel of equal-fragment fission and two «standard asymmetric» channels S1, S2 are considered. The latter are associated to peaks in the large fragment that in turn are linked so some shell closure or deformed shell closure. More recently, the analysis of the external «wings» of the mass distributions has induced to add a third channel S3 associated to a peak in the small fragment; the GMRS analysis uses all the three channels plus a non-gaussian queue in the central, symmetric channel.
It comes without say that we do not still have a model of how or why should the electroweak bosons contribute to the nuclear potential in a way sensible enough to be part of the spin-orbit interaction that justifies the nuclear shells. Whatever it is, it should be a phenomena enhanced when the mass of the nucleus coincides with the mass of the electroweak boson, as we discussed ten years ago. By now, lets review the nuclear evaluations and we will come back in the next post to the question of the mechanism.
UKFY3 has been the evaluation eventually incorporated to the JEFF database . In the work of Mills it is considered that no better adjustment is got beyond five peaks -although the current evaluation seems to show an extra wing-, and then it makes visible the S1 and S2 channels of Brosa. They are supposed to be associated to the N=82 shell and to some other deformed neutron shell, and indeed the fit is nicely constant for the peaks in the large fragments. Still, and given the absence of an electroweak particle of mass similar to the S2 peak, for this channel we have painted in the graph, in light blue, both the large and small fragment peak. The position of the fragment is also undetermined by the average number of neutrons or light fragments that are emitted during the fragmentation, and so we have drawn bands around it. We see in any case that, while increasing with the total atomic mass of the nuclei, this peak remains between the values of mass of the Z0 and W boson, and so I still hold to the conjecture is that S2 is really contributed by the lower fragment, that resonates with these bosons.
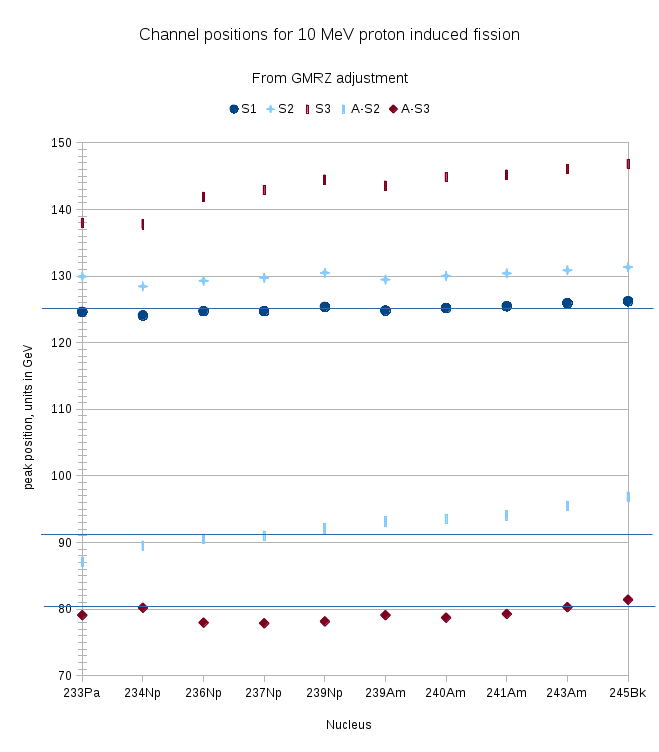
In fact this conjecture is partly supported by the GMRS analysis, who add to their fits a third channel S3 pivoting on the lower fragment. In fact other groups have also considered that either the N=50 shell or the Z=40 and Z=50 shells should have some role in the «scission point» of the nucleus, so this addition is consistent. And the interesting point is that this S3 channel keeps constant very nearby of the mass of the W boson. The adjustment of the S2 channel improves in some sense too: while it is still best considered constant to a high-mass fragment, the average of the corresponding lower fragment, A-x (note that GMRS do not provide data on prompt neutrons), is pretty near of the mass of the \(Z^0\) boson. Without considering the noise from neutrons and light fragments, we had an average of \(92.34 \pm 2.91 \; GeV\) for the «A-x» S2 peak and \(79.21 \pm 1.14 \; GeV\) for the «A-x» S3. Note that in the graphs the lines are set to the measured values of H, W and Z, not to these averages.
GMRZ 10 MeV protons
| S1 | S2 | S3 | A-S2 | A-S3 | |
|---|---|---|---|---|---|
| 233Pa | 124.6347 | 129.94425 | 137.95515 | 87.09525 | 79.08435 |
| 234Np | 124.0758 | 128.45385 | 137.76885 | 89.51715 | 80.20215 |
| 236Np | 124.72785 | 129.2922 | 141.86745 | 90.5418 | 77.96655 |
| 237Np | 124.72785 | 129.75795 | 142.8921 | 91.00755 | 77.8734 |
| 239Np | 125.3799 | 130.50315 | 144.47565 | 92.12535 | 78.15285 |
| 239Am | 124.821 | 129.4785 | 143.54415 | 93.15 | 79.08435 |
| 240Am | 125.1936 | 130.0374 | 144.84825 | 93.5226 | 78.71175 |
| 241Am | 125.47305 | 130.41 | 145.22085 | 94.0815 | 79.27065 |
| 243Am | 125.9388 | 130.87575 | 146.0592 | 95.47875 | 80.2953 |
| 245Bk | 126.21825 | 131.3415 | 146.8044 | 96.876 | 81.4131 |
| Averages | 125.11908 | 130.009455 | 143.143605 | 92.339595 | 79.205445 |
Converted with 1 AMU = 0.9315 GeV
UKFY3
| Values in atomic mass units | Values in GeV | |||||||||
|---|---|---|---|---|---|---|---|---|---|---|
| Â+ D1 |  – D1 |  + D2 | 2* | n | Reaction |  + D1 |  – D1 |  + D2 | – D1 +n | – D1 +n |
| 139.746 | 89.514 | 134.452 | 229.26 | 2.74 | Th232H | 130.173399 | 83.382291 | 125.242038 | 85.934601 | 80.642291 |
| 140.572 | 89.328 | 133.115 | 229.9 | 2.1 | U232T | 130.942818 | 83.209032 | 123.9966225 | 85.165182 | 81.109032 |
| 139.939 | 90.181 | 135.121 | 230.12 | 2.88 | U233H | 130.3531785 | 84.0036015 | 125.8652115 | 86.6863215 | 81.1236015 |
| 141.327 | 89.773 | 134.298 | 231.1 | 0.9 | Th232F | 131.6461005 | 83.6235495 | 125.098587 | 84.4618995 | 82.7235495 |
| 140.879 | 90.581 | 133.784 | 231.46 | 1.54 | U233F | 131.2287885 | 84.3762015 | 124.619796 | 85.8107115 | 82.8362015 |
| 140.943 | 90.597 | 133.876 | 231.54 | 1.46 | U233T | 131.2884045 | 84.3911055 | 124.705494 | 85.7510955 | 82.9311055 |
| 139.681 | 91.879 | 134.531 | 231.56 | 3.44 | U235H | 130.1128515 | 85.5852885 | 125.3156265 | 88.7896485 | 82.1452885 |
| 140.92 | 92.88 | 133.53 | 233.8 | 1.2 | U235T | 131.26698 | 86.51772 | 124.383195 | 87.63552 | 85.31772 |
| 140.92 | 92.88 | 133.529 | 233.8 | 1.2 | U235F | 131.26698 | 86.51772 | 124.3822635 | 87.63552 | 85.31772 |
| 139.93 | 94.07 | 133.8 | 234 | 3 | Np237H | 130.344795 | 87.626205 | 124.6347 | 90.420705 | 84.626205 |
| 140.766 | 93.754 | 133.958 | 234.52 | 1.48 | U236F | 131.123529 | 87.331851 | 124.781877 | 88.710471 | 85.851851 |
| 139.916 | 94.664 | 133.225 | 234.58 | 3.42 | U238H | 130.331754 | 88.179516 | 124.0990875 | 91.365246 | 84.759516 |
| 140.604 | 94.636 | 133.936 | 235.24 | 1.76 | Np237F | 130.972626 | 88.153434 | 124.761384 | 89.792874 | 86.393434 |
| 140.671 | 94.629 | 133.997 | 235.3 | 1.7 | Np237T | 131.0350365 | 88.1469135 | 124.8182055 | 89.7304635 | 86.4469135 |
| 139.926 | 95.414 | 132.538 | 235.34 | 3.66 | Pu239H | 130.341069 | 88.878141 | 123.459147 | 92.287431 | 85.218141 |
| 139.645 | 96.115 | 132.876 | 235.76 | 4.24 | Pu240H | 130.0793175 | 89.5311225 | 123.773994 | 93.4806825 | 85.2911225 |
| 140.414 | 95.726 | 133.535 | 236.14 | 1.86 | Pu238T | 130.795641 | 89.168769 | 124.3878525 | 90.901359 | 87.308769 |
| 140.823 | 95.677 | 134.173 | 236.5 | 1.5 | U238F | 131.1766245 | 89.1231255 | 124.9821495 | 90.5203755 | 87.6231255 |
| 139.354 | 97.286 | 132.871 | 236.64 | 4.36 | Am241H | 129.808251 | 90.621909 | 123.7693365 | 94.683249 | 86.261909 |
| 140.584 | 96.476 | 134.087 | 237.06 | 1.94 | Pu239F | 130.953996 | 89.867394 | 124.9020405 | 91.674504 | 87.927394 |
| 140.579 | 96.541 | 134.089 | 237.12 | 1.88 | Pu239T | 130.9493385 | 89.9279415 | 124.9039035 | 91.6791615 | 88.0479415 |
| 139.599 | 97.961 | 133.591 | 237.56 | 4.44 | Pu242H | 130.0364685 | 91.2506715 | 124.4400165 | 95.3865315 | 86.8106715 |
| 140.667 | 97.293 | 134.185 | 237.96 | 2.04 | Pu240F | 131.0313105 | 90.6284295 | 124.9933275 | 92.5286895 | 88.5884295 |
| 140.681 | 98.139 | 134.231 | 238.82 | 2.18 | Am241F | 131.0443515 | 91.4164785 | 125.0361765 | 93.4471485 | 89.2364785 |
| averages | 130.762650375 | 87.560767125 | 124.639668 | 89.769974625 | 85.1891004583 | |||||
Value of n is A – 2*Â
Deja una respuesta